It is no surprise that the Washington Nationals came out of the gates on fire. They were one of the best regular season teams in the league last year, and they didn’t lose any major talent to free agency or serious injury (recent Adam Eaton injury notwithstanding.) One of the bigger surprises though has been the resurgence of long-time hometown hero Ryan Zimmerman. We’ve only gotten through the first month of the season, but it’s never too early to take a look at what’s causing this #Ryanaissance.
At a first glance, I wanted to compare how much better he’s doing in the context of himself. When I say this, I mean I’m asking myself one question: How does his first month of the season compare with the first month of his season over the course of his career? Does he always get off to a hot start? Does he normally get off to a slow start?
A quick glance of every April of his 11-year career shows us this:
| PA | AB | H | HR | AVG | OBP | OPS | wRC+ | |
| 2006 | 106 | 95 | 23 | 4 | .242 | .324 | .735 | 88 |
| 2007 | 118 | 110 | 26 | 1 | .236 | .288 | .615 | 63 |
| 2008 | 126 | 116 | 27 | 3 | .232 | .270 | .631 | 61 |
| 2009 | 99 | 90 | 26 | 5 | .289 | .354 | .898 | 133 |
| 2010 | 51 | 47 | 17 | 4 | .361 | .411 | 1.199 | 218 |
| 2011 | 37 | 28 | 10 | 1 | .357 | .486 | 1.022 | 184 |
| 2012 | 68 | 58 | 13 | 1 | .224 | .324 | .688 | 85 |
| 2013 | 61 | 53 | 12 | 1 | .226 | .311 | .670 | 86 |
| 2014 | 37 | 33 | 12 | 2 | .363 | .405 | 1.041 | 186 |
| 2015 | 101 | 92 | 20 | 2 | .217 | .277 | .658 | 77 |
| 2016 | 83 | 73 | 16 | 1 | .219 | .301 | .603 | 64 |
| 2017 | 96 | 88 | 37 | 11 | .420 | .458 | 1.341 | 243 |
This tells us a couple of things. First, this is unnatural. Although he hasn’t had particularly terrible starts over the course of his career, he doesn’t set the world on fire. He usually starts off somewhere slightly below league average. Obviously, his 2017 was incredible and out of the norm, but it is significant that this April cannot just be chalked up to “Well, he had a hot start.” Plenty of players have hot starts, but only three players have hit 11 home-runs this month alone. Okay, so, if there’s something causing this, what is it?
Plate Discipline
For the next section, I could compare the data for every year of his career, but that would take me forever and would probably get confusing to read, so instead, I’ll shorten it to three years: this year, last year, and 2009. (2009 might seem specific, and that’s because it is. It’s his best full-season and we will use it as a benchmark for his personal success). We’ll start by looking at his plate discipline.
When sabermetrically examining someone’s plate discipline and selection, there are a few statistics necessary to understand. Fortunately, they are all percentages and easy to comprehend.
- O-Swing%: The percentage of pitches outside the strike zone a player swings at
- Z-Swing%: The percentage of pitches inside the strike zone a player swings at
- O-Contact%: The percentage of swings that make contact on pitches outside the zone
- Z-Contact%: The percentage of swings that make contact on pitches inside the zone
- Swing%: The percentage of pitches the player swings at, regardless of location
- Zone%: The percentages of pitches thrown in the strike zone
- SwStr%: The percentages of swings and misses
So, let’s take a look at Ryan Zimmerman’s discipline stats. These are all from the April of their respective years, as to most accurately put his 2017 data in perspective.
| O-Swing% | Z-Swing% | Swing% | O-Contact% | Z-Contact% | Contact% | Zone% | SwStr% | |
| 2009 | 26.20% | 59.60% | 41.70% | 76.40% | 82.60% | 80.50% | 46.60% | 8.10% |
| 2016 | 27.40% | 56.60% | 40.90% | 50.00% | 82.90% | 71.10% | 46.30% | 11.80% |
| 2017 | 33.20% | 59.00% | 44.70% | 76.80% | 85.70% | 82.00% | 44.40% | 8.00% |
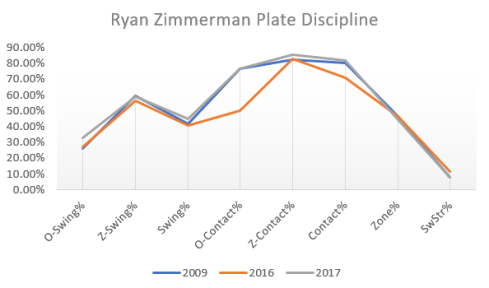
It’s a lot of numbers that all look pretty similar: I get it. But stick with me and unpack some of the more important trends. If you look at the graph, you’ll notice one thing: The blue line (2009) and the gray line (2017) are extremely similar. The orange line (2016) was one of the worst starts he’s ever had to his career, so it’s a good thing for Zimmerman that he’s looking more like his 2009 self than his 2016 self. But let’s delve into the specifics and not just trends: what is it that’s changed? The thing that stands out most to me is his O-Contact%. He’s making far less contact with pitches outside of the zone. At first, this might sound like a good thing – you don’t want to make contact with bad pitches, right? Well, yes and no. The problem isn’t that he wasn’t swinging any less at pitches outside the zone, it was that he wasn’t hitting the pitches he was swinging at, which can be seen in his SwStr% and his Contact%. So, interesting. By looking at the first months of the best year of his career, the worst year of his career, and this year, we can see some interesting trends. He is repeating behaviors from the best year he’s ever had: swinging more, making more contact, and missing less. Now, I know what you’re thinking. “He’s doing better because he’s hitting the ball more, idiot. Way to go, Sherlock,” but please – stick with me. He’s swinging and making more contact, but that begs the next question I have. “Swinging at strikes in the zone,” is pretty generally a key to success, but what areas of the zone is he selectively hitting that is leading to so much success?
Heat maps and Pitch Selection
The next section will take a bit of brain power but will give us a better idea of what pitches and pitch locations Ryan Zimmerman is better at hitting. For brevity’s sake, we’ll stick to two types of pitches (fastballs and “offspeed,” which will consist of changeups, curveballs, and sliders,) widen the scope to “All Counts,” (instead of looking at every single count,) and look specifically at where he is swinging. We will also compare the entire seasons of 2009 and 2016 instead of isolating April so that we can get the largest sample size possible. The larger the sample size, the more we can confidently predict what swing locations correlate with either the 2009 success or the 2016 woes. Without further ado, let’s jump into the wonderful world of heat maps.
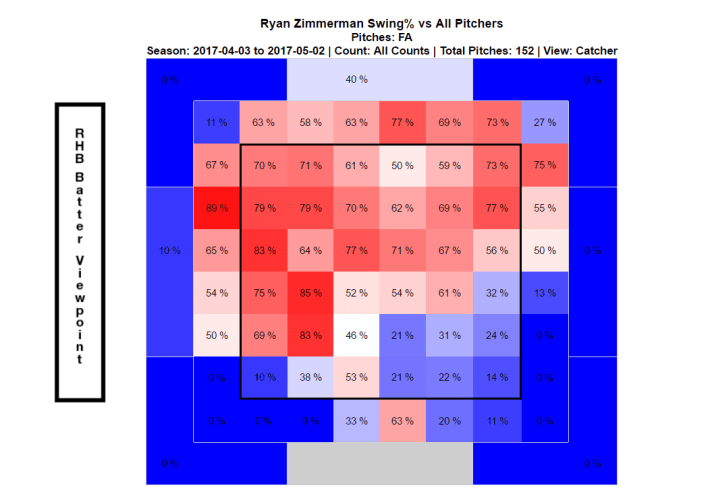
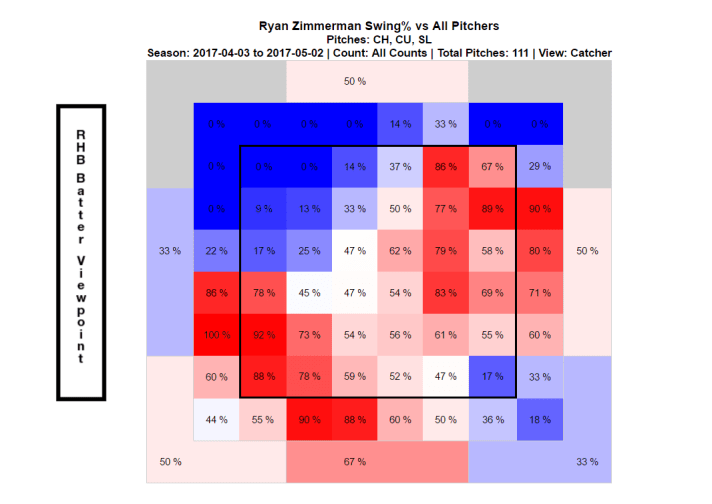
Here is a heat map of all the locations in which Ryan Zimmerman has swung at a fastball in 2017. We are looking at the strike zone from the Catcher’s perspective, and Ryan Zimmerman is a right-handed hitter, as displayed by the black bar on the left. Immediately something sticks out: so far, this year, he’s swung at a lot of fastballs, but really pulls the trigger on inside pitches (i.e., pitches closer to him.) Fastballs high in the zone are another pretty significantly hot zone, even when they are slightly outside of the zone. This is likely where a chunk of the aforementioned O-Contact% comes from: he swings at a lot of high fastballs and probably hits a significant amount of those. So, cool. He swings at a lot of fastballs and likes them inside. Let’s look at all the fastballs he swung at in 2016 and see if there’s a difference. Remember: we’re using 2016 as a benchmark for “these things=poor performance for Ryan Zimmerman.”
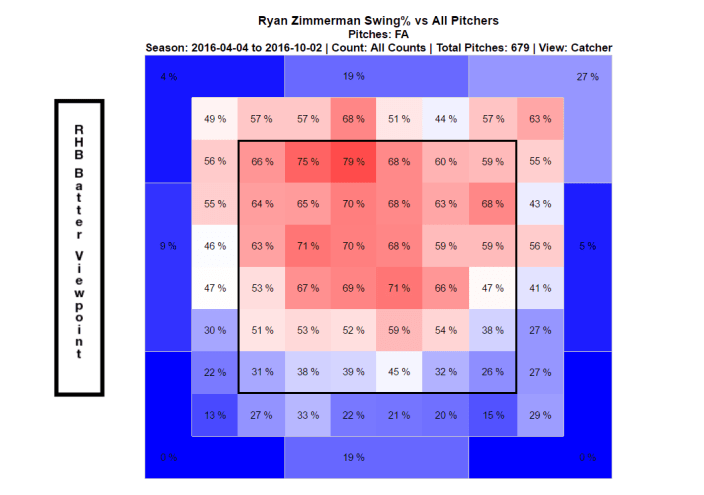
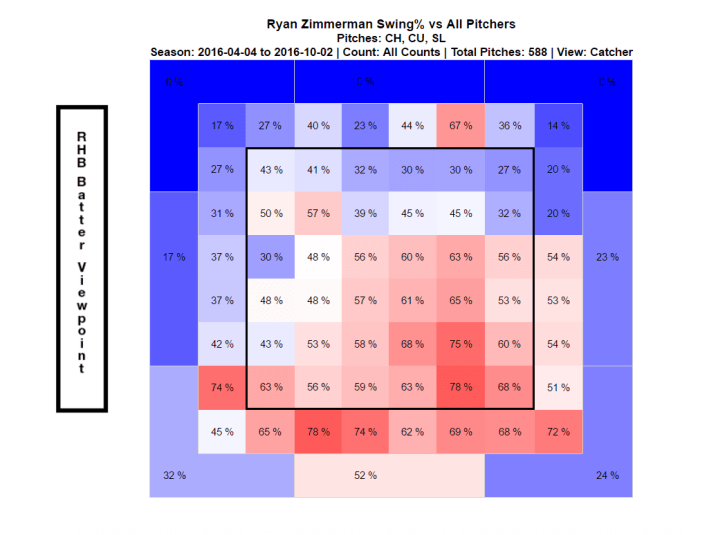
Wow, okay. Lots of differences here. Don’t much attention to individual %’s and focus more on trends; yes, the squares aren’t as red as the 2017 fastball map. That’s because we’re comparing a year’s worth of fastballs vs. one month’s worth. However, there are some significant trends that we can look at in tandem with his discipline stats. Instead of swinging at inside pitches, he swung at a lot more pitches up in the zone. He also swung at a lot of pitches outside the zone, but not limited to high and down the middle like in 2017; there are a lot of pitches out of the sides of the strike zone that he swung at in 2016. If you look up at the very top right, he swung at almost 27% of those pitches. This puts his 2016 O-Contact% in perspective: it’s hard to hit that pitch, but he wasn’t making it easier on himself by swinging at it nearly a third of the time it was thrown. Let’s try and take a look at 2009 and see where he successfully hits fastballs.
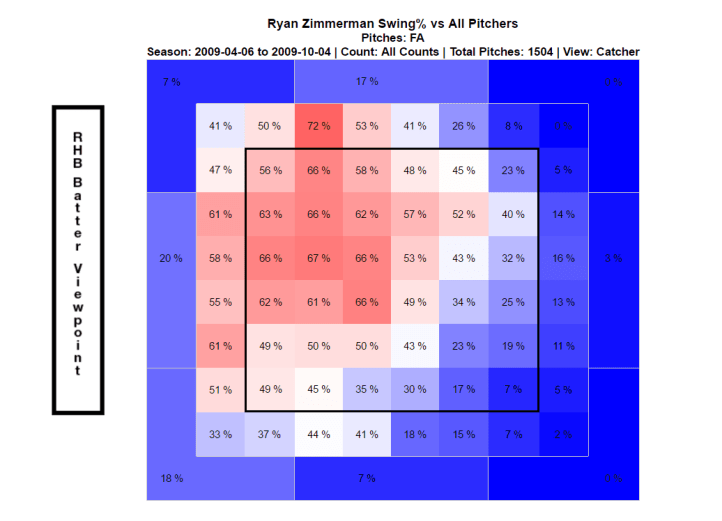
I’m not sure about you guys, but by this point, I’m not particularly surprised. I’m noticing a recurring theme: when Ryan Zimmerman swings at inside fastballs, he has years like 2009 and is productive. Unsurprisingly, when he swings at pitches outside of the zone, he sucks. What is surprising though, is just how many more fastballs he swung at in 2009 than in 2016. Under all counts in 2009, he swung at 1504 fastballs over the course of the season. In 2016, he was only swung at 679. Why the decrease? I personally have no idea, although why he swung at less isn’t the point. The point is he is more successful when he swings at fastballs.
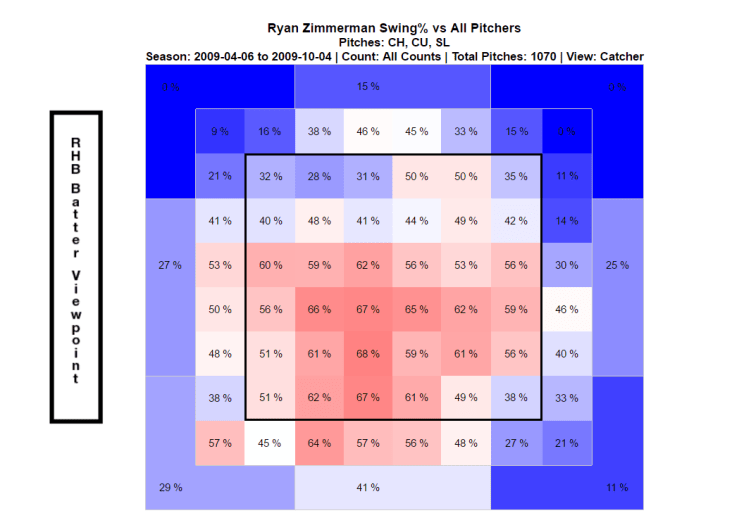
Yet again, Zimmerman has success inside. Here we can give a bit more room for error on pitches outside of the zone because all the pitches included (changeups, sliders, and curveballs,) are meant to trick him, and probably thrown in two-strike counts where he needs to protect. However, he’s still mashing that inside corner. It’s also a good thing he isn’t missing that outside half. If a pitcher is throwing anything offspeed there, Zimmerman better not be missing it. And by all accounts, his monster stats tell us that no, he is not missing pitches hung in the zone. So, 2017 Zimmerman still loves that inside corner and isn’t missing offspeed pitches in the zone.
Here are 2016 Zimmerman’s swings at offspeed pitches. Again, accounting for the difference in a month’s data vs. a year’s data, there are still a couple interesting points to make here. For starters, he swung at a lot of pitches low or outside of the zone. There aren’t very many ways to interpret this; he didn’t have good discipline when it came to offspeed pitches, likely because they were on pitches in which he was behind in the count, and would strike out. He also didn’t do a good job of taking advantage of pitches left up in the zone. Remember: the red zones are not how often the pitcher threw it there but is a measure of when Ryan Zimmerman swung when the pitch was thrown there.
To continue to follow suit and kind of beat a dead horse, Zimmerman does a good job of hitting pitches closer to him. His discipline wasn’t great, but there is plenty room for error because these are pitches intended to fool hitters and get them to swing at pitches outside of the zone. The difference is that Ryan Zimmerman is successful when he sticks to his strengths and takes advantage of inside pitches while limiting swings at bad pitches.
Something else worth nothing that is extremely significant:
| Plate Appearances PA | Pitches Swung At | |
| 2009 | 99 | 2,574 |
| 2016 | 83 | 1,827 |
In 2009, Ryan Zimmerman swung at 747 more pitches than he did in 2016. Of course, this alone is not enough to determine when he succeeds vs. when he doesn’t. He was younger and stronger in 2009, and the makeup of the team around him changes how he is pitched to, and what opportunities he has to hit. Boiled down though, he does better when he swings more, and swings more at pitches he likes.
So, what does any of this mean?
I have no idea. This column is appropriately named as “irresponsibly early,” because we’re only a month into the season. A hundred different things could happen that entirely refute me and make me look foolish. But, looking at how Ryan Zimmerman performs over the course of his career, we sifted out some pretty interesting points: Ryan Zimmerman hits inside pitching well, he does better when he swings more and gives himself a chance to hit, and needs to lay off pitches outside the zone. Some of these are kind of self-explanatory, like not swinging at balls. Obviously, there are plenty of other things to look at, like mechanics in his swing, his own health, and things like launch angles or the speed of the ball off his bat. However, we took a pretty in-depth look at when Ryan Zimmerman succeeds vs. when he fails. All in all, Ryan Zimmerman’s off to a hot start for an impressive Washington Nationals squad, and next time you’re watching a game, take note of what pitches and locations he swings at. If he can continue to wail that inside corner and maintain a high level of contact with the pitches high in the zone and swing in high volume, the Nationals might just be in for a resurgence of their favorite veteran.

This is really good dude
LikeLike
I have a tragically and historically bad relationship with numbers, but I still found this interesting. I want to think of some clever response, but . . . I like Ryan Zimmerman and am glad he’s doing well. That’s all I got.
LikeLike